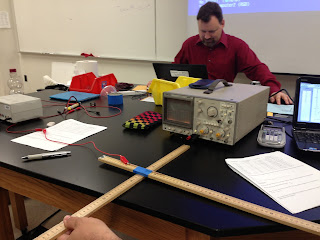
To use a simple antenna to study the behavior of electromagnetic radiation.
Equipment:
- Small Guage Straight Copper Wire
- (2) Meter Sticks
- Frequency Generator
- Oscilloscope
- BNC Connector
Create a transmitter by attaching the copper wire to a meter stick with masking tape and connect one end to the frequency generator. Create a receiver by pluggin the BNC connector into the oscilloscope (channel 1). Use the frequency generator to create a frequency of 30 kHZ and turn the amplitude to its maximum. Change the time/div setting on the oscilloscope to 0.1 ms and decrease the voltage/div until a signal in seen on the screen. Measure and record the peak to peak amplitude of the EM wave and record them for several trials.
Below is the data table of these values.
Distance
(m)
|
# of Divisions Peak to
Peak
|
Vertical Scale (mV)
|
Peak to Peak
Amplitude (mV)
| |
0.5
|
3.3
|
10.0
|
5.5
|
55
|
0.1
|
3.2
|
10.0
|
5.0
|
50
|
0.2
|
3.2
|
10.0
|
4.0
|
40
|
0.2
|
3.2
|
5.0
|
6.4
|
32
|
0.3
|
3.2
|
5.0
|
5.2
|
26
|
0.3
|
3.2
|
5.0
|
4.8
|
24
|
0.4
|
3.2
|
5.0
|
4.2
|
21
|
0.4
|
3.2
|
5.0
|
4.0
|
20
|
0.5
|
3.2
|
5.0
|
3.2
|
16
|
0.5
|
3.2
|
5.0
|
2.8
|
14
|
0.6
|
3.2
|
5.0
|
2.6
|
13
|
0.6
|
3.2
|
5.0
|
2.4
|
12
|
Conclusion:
The data plot of peak to peak amplitude as a function of distance is shown below. The graph appears to take on an inversely proportionate shape.
The trendlines of A/r and A/r^2 are included on the graph. The A/x function fits the data better than the A/r^2 does, however, still is not a great fit. The A/r^n function that is also included fits the best. The data does not fit the A/r function, what we would expect if it were a point charge, because the tansmitter is linear perpendicular to the receiver. Therefore, we must take each dx and consider that instead of a single point source.


No comments:
Post a Comment